 On Friday, March 20, our Renewable Energy website OliNo was hit by the Slashdot effect. The cause was the story Building Your Own Solar Panel In the Garage posted on Slashdot, linking back to this OliNo site. The impact was huge. During the Slashdot effect, we received more than 27,000 visitors in a single day. This is a detailed analysis of the Slashdot effect and actions we can take to survive the next hit.
Slashdot
Slashdot.org is a very popular technical oriented news website which they present as “News for Nerd, stuff that matters”. The website picks the hottest / coolest submitted stories and posts them on their main page, with an interval of around one story per hour. These stories will typically contain a link back to the original article or background information supporting the story.
The Slashdot website serves around 3 million pages on weekdays, and slightly less on weekends. When Slashdot links a site, often a lot of readers will hit the link to read the story. This can easily throw thousands of hits at the site in minutes. When all those Slashdot readers start crashing the party, it can saturate a smaller website completely, causing the site to buckle under the strain. When this happens, the site is said to be “Slashdotted.” This is exactly what happen to this website on Friday 20 March 2009.
Submitted a story
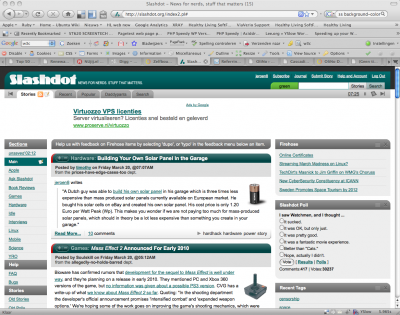
On Friday, March 20 2009, I had submitted a very interesting story about Building Your Own Solar Panel In the Garage to Slashdot. One of the moderators at Slashdot selected the story and posted it on Slashdot. The article appeared on the slashdot main page on Friday March 20 @07:07AM (CET GMT+1). The impact was huge.
Huge amount of Visitors
Normally this still young Renewable Energy website gets around 100 visitors per day. Within one hour, this number climbed to more than 1,000 visitors. At the moment of the post, Europe was just waking up, the US west-coast was just going to bed (10:00PM local time) and the US east-coast was still sleeping (01:00AM local time). This effect was clearly visible on the worldmap of google analytics.
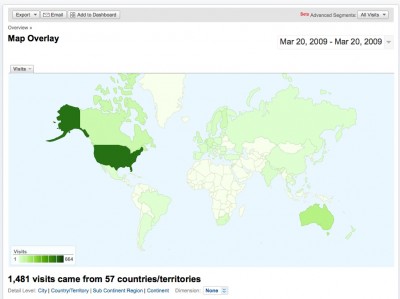
The visitors all over the world at 08:47AM (CET)
Most visitors came from the USA. Particularly the west-coast which was still awake.
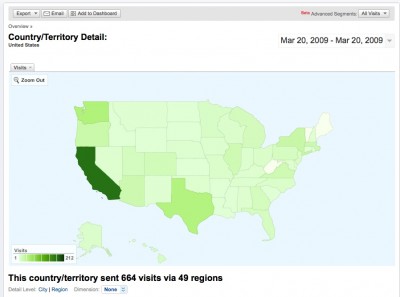
The visitors coming from the USA at 08:47AM (CET)
The number of visitors kept growing each hour. At 12:00PM (CET) / 06:00AM (GMT-5) the OliNo site received 1,940 visitors per hour. At that moment the server could not handle the traffic anymore, the http response time went through the roof (more on that later). At the peak 03:25PM (CET) / 09:25AM (GMT-5), the OliNo site received 2,320 visitors per hour. This translates back to around 39 visitors every minute. After the peak, the number of visitors per hour went slowly down with a few hundred visitors less each hour until it stabilised at 11:00PM (CET) / 05:00PM (GMT-5) with 200 visitors each hour. That day we received more than 27.000 visitors.

Visitors per hour on Friday 20 March (GMT-5)
During the day more and more visitors came from different parts of the world. The majority of visitors came still from the USA. At the end of the day we have received 27,169 visitors from 134 countries/territories.
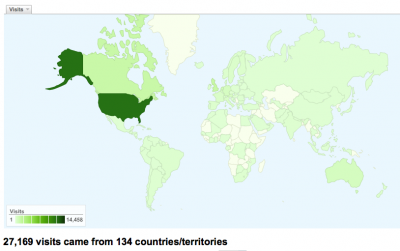
Visitors all over the world at the end of the day
| Top 10 | |
|---|---|
| Country/Territory | Visits |
| United States | 14,458 |
| United Kingdom | 1,1921 |
| Canada | 1,875 |
| Netherlands | 1,006 |
| Australia | 835 |
| Germany | 742 |
| Austria | 644 |
| Belgium | 517 |
| France | 454 |
| Italy | 396 |
Amazon EC2
The OliNo website is hosted in the Amazon Elastic Computer Cloud (Amazon EC2). See also the article OliNo in the cloud for the reason why OliNo moved to Amazon EC2.
The OliNo website is using a small instance type. This instance has 1.7 GB of memory, 1 EC2 Compute Unit (1 virtual core with 1 EC2 Compute Unit), 160 GB of instance storage, 32-bit platform. One EC2 Compute Unit (ECU) provides the equivalent CPU capacity of a 1.0-1.2 GHz 2007 Opteron or 2007 Xeon processor. The instance is running in the us-east-1b datacenter of Amazon.

The OliNo webserver hosted in the Amazon computer cloud
Software
The instance is based on a Linux Ubuntu 8.04 LTS server edition. On this server the following software is installed
| Webserver | Apache/2.2.8 |
| Blog software | WordPress 2.7.0 |
| Database MySQL server | 5.0.51a |
On the Ubuntu server there are two instances of WordPress running. One instance for the Dutch and one for the international OliNo website, each with their own MySQL database.
The data (wordpress content and databases) is stored on an Elastic Block Store (EBS) device of 10 GB. The filesystem is formatted with XFS.
Server load
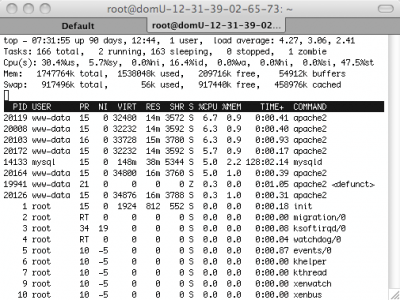
As soon as the first group of visitors came to the website, there was an immediate impact on the server load. The average load, using the Linux top command, is about 0.3 during normal traffic. At 08:35AM (CET) the server load was already increased to 4.27, a clear indication that the server is already overloaded.
The response time of the website was still good, but will change dramatically as soon as the east-coast of the USA is awaking….
Response time of the Website
The response time of the website is monitored by a global monitoring network service of Pingdom. They have probe servers which are located in the USA (TX, CA, VA), Canada (Monteal), UK (Reading, London), Sweden (Vasteras, Stockholm) and France (Paris). With an interval of 5 minutes the response time of the website is measured from the different locations. An notification is send when the server is unavailable.
The average response time per day (the numbers of the probe servers averaged) is around 915 ms.
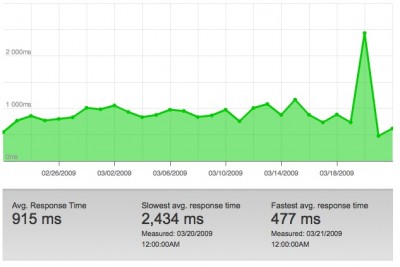
The global daily average response time of the OliNo website
The impact of the Slashdot effect is clearly visible in the response time of the web server. During the peak, as already seen in the graph above, the response time went sky-high. This happened at exactly 12:00PM (CET). An explanation could be that at the same time, the Europeans take a lunch break (and may start surfing on their work station) and the east-coast of the USA awakens (07:00AM local time). The result is the “perfect storm” completely overloading the web server.
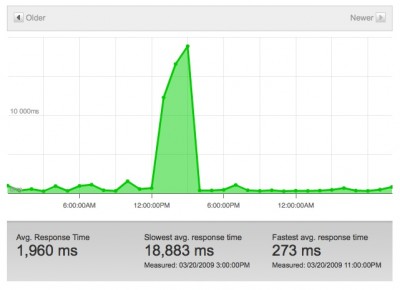
The global hourly average response time of the OliNo website on Friday 20 March (CET)
The situation was worse than can been seen in the graph. I timed the http response of the webserver during the peak using the following command:
time wget http://www.olino.org/us/articles/2009/03/19/building-my-own-solar-panel
The response time was between the 30 sec – 5 minutes!
During the peak the Pingdom monitoring service started to send error notifications about the server response.
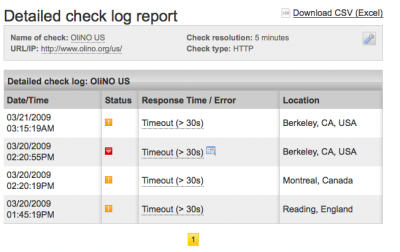
The servers response errors detected by Pingdom.
Bandwidth
To see if we have encountered a bandwidth bottleneck, let’s make some fast calculations.
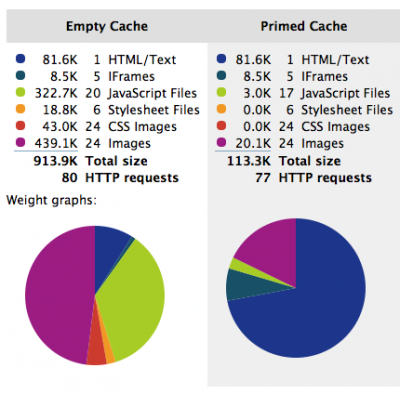
The size of the webpage can be found by using the nice Firefox plugin YSlow.
So the webpage is quite large, with 914 KB (for first time visitors). During the peak we got 2320 visitors per hour. This generates 914 KB x 2320 = 2 GB per hour of data traffic. This calculates back to 590 KB/s of continuous traffic. This should not be the bottleneck.
How to survive the Slashdot Effect?
There are several actions we can take to survive a future Slashdot effect.
- Tuning of the web-server
- Optimize the website
- Optimize wordpress
- Tuning of the MySQL server
- Run multiple instances with a loadbalancer
- Using high-CPU amazon instances (High-CPU Medium / Extra Large)
Tuning of the web-server
Our Apache web-server is not (yet) tuned for performance. This is a first step we can take. There is a good document about Apache Performance Tuning on the website of Apache. One of the first tips is to check the MaxClients option. The current (default) setting is 150. Setting this value too low, should result in error in the log.
server reached MaxClients setting, consider raising the MaxClients setting
I checked the Apache log and this error is not shown, so the value is not too low. Setting this value too high will result in too much memory usage and this will result in swapping. The tip of Apache is to divide the available amount of memory for Apache (let’s use 1GB in our case) by the amount of memory used in “Top” by a single Apache thread. Our Apache thread uses between the 16-20MB per thread. So 1024 MB reserved for Apache / 20MB per Apache thread ~ 50 MaxClients. It seems we need to reduce the number of MaxClients from 150 to 50 for our Apache configuration.
Another option we can use it so disable access logging. Writing log information is a time consuming process. Although Apache keeps the log files open so that it’s just a case of writing the information, this can take up valuable time. In our case we do not use the access log. So we can save few processor cycles by disabling it. To do this, we simply comment out the log lines in the configuration file. Error logging will still be enabled.
Optimize the website
One of the first things we did is to analyse the website with the very nice Firefox plugin YSlow. This gives a clear indication that the web site needs a lot of tweaking to get a better performance. Here are our results
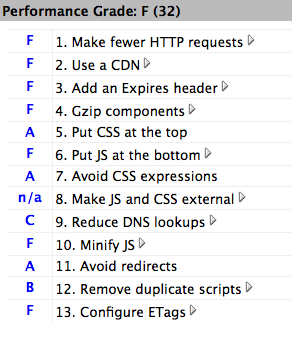
The suggested improvements by Yslow
The improvements suggestions are sorted on most impact on top. So the tip to minimize HTTP requests, is the first we should tackle. The webpage has 14 external Javascript files, 6 external CSS StyleSheets and 24 CSS background images. The tip given here is to combine as much Javascript files and Stylesheets into both single files. So preferably you should have only one Javascript and one CSS file. It is also suggested to use minified version for the Javascript files.
As we use a lot of WordPress plugins, with some having their own Javascript files, this would mean we need to do a lot of customizing. I am wondering if this is worth the effort with the new WordPress 2.8 already announced where a lot of there issues will be solved automatically.
What about Javascript from Google? We use Google Javascripts for showing Ads with Google Adsense and monitoring traffic using Google Analytics. Does it make sense, to take these scripts and combine them with your own Javascripts to improve performance? Is it allowed and does it work? Or is it faster to keep them on the Google servers so that they are already in the browsers cache of the visitor?
The second tip to use a Content Distribution Network (CDN) is something Amazon can offer with CloudFront. Amazon CloudFront delivers your content using a global network of edge locations. Requests for your objects are automatically routed to the nearest edge location, so content is delivered with the best possible performance. When the javascript file(s), CSS file(s) and theme images are loaded on the CDN this will offload a lot of HTTP request from the main web server. It should also result in a faster loading website for the visitor because the content to load is located more closely to the physical location of the visitor. Some digging on the internet shows that using Amazon Cloudfront will double the bandwidth costs for your website.
The following tips:
- Gzip components
- Put JavaScript at the bottom
- Minify JavaScript
should be handled with the introduction of the new upcoming WordPress 2.8
The remaining tips like adding Expires header and configure ETags are both cache related. I guess this will only work for re-visiting users. So this will not prevent an overload of the server due to the Slashdot effect.
Optimze wordpress
We use WordPress as blogging software. One of the first thing you read about improving the performance of WordPress is to use caching. We use the WP Super Cache plugin. I had already done tests with it and it seems to improve performance significantly when reloading the same page multiple times. However, we never had tested it under “Slashdot effect” conditions, where thousands of users simultaneous want to access the same webpage on the website. Theoretically this cache module should be able to handle this smoothly.
Tuning of the MySQL Server
Prior the slashdot effect, the mysql database settings where optimized with the MySQL Performance Tuning Primer script. I changed some MySQL settings (query_cache, table_cache, tmp_table_sizd and max_heap_table_size). See also the results of a recent performance analysis and the current MySQL settings.
Run multiple instances with a Loadbalancer
To be able to handle a bigger load on the webserver one could start using multiple instances. The next step could be running two small instances with the apache webserver with wordpress and a third instance with MySQL. The web traffic should be load balanced over the two web servers. Until the time comes when Amazon will offer a load balancing service in their EC2 environment, people are forced to use a software-based load balancing solution. This effectively means we need at least 4 small EC2 instances (2 x Webserver, MySQL server and a software loadbalancer). Effectively quadrupling the current cost price of using a single EC2 instance.
The loadbalancer will balance the load over the running webserver instances. All the web server instances connect with a single MySQL database so there is a single state of the website. This load balancing set-up is similar how Slashdot has set-up their hardware. And this is clearly a proven set-up.
Together with the announcement of Amazon for their loadbalancer solution they announced a feature called auto-scaling. This makes it possible to start / stop instances based on the load of a group of instances using a voting mechanism. This could be very effective for surviving the slashdot effect. When there is a huge peak in visitors, auto-scaling could start-up more instances to handle the increased load. The loadbalancer will balance the load over the running web server instances. When the load drops again because the visitors are gone, auto-scaling will stop some of the running instances. This makes sense, because with Amazon EC2, you only pay for running instances per hour.
So let’s see what Amazon has to offer when they introduce their new load-balancing and auto-scaling solutions.
Using high-CPU Amazon Instances
If CPU is the bottleneck, we can use high-CPU instance to run the website. Amazon offers the following high-CPU instances
- High-CPU Medium Instance 1.7 GB of memory, 5 EC2 Compute Units (2 virtual cores with 2.5 EC2 Compute Units each), 350 GB of instance storage, 32-bit platform
- High-CPU Extra Large Instance 7 GB of memory, 20 EC2 Compute Units (8 virtual cores with 2.5 EC2 Compute Units each), 1690 GB of instance storage, 64-bit platform
One EC2 Compute Unit (ECU) provides the equivalent CPU capacity of a 1.0-1.2 GHz 2007 Opteron or 2007 Xeon processor.
The server load snapshot taken at 08:35AM (CET) is a clear indicator the server is overloaded. However looking at the details reveals that user processes is only taking 30% CPU usage and the processor is still 16.4% idle.
So high-CPU instances may not solve the performance problems.
As you can see, we are clearly guessing now. The only way to find the real bottleneck(s) is to do your own performance tests on an identical non-production set-up. During these tests the load on the server can be controlled and the server can be monitored closely. The bottleneck can be CPU, IO (performance EBS) or network. There are several options which can be tuned like the Apache webserver, the MySQL database or even the Linux kernel. This process is iterative. Perform your load test, find the bottlenecks, try to solve them by adjusting the set-up, do your performance tests again. Repeat this process until you are satisfied with the performance.
Your suggestions
Do you have suggestions how to survive the slashdot effect? Do have similar experiences? What did you do to improve? How many visitors should a single instance WordPress website be able to handle?
Do have some answers? Post them as comments below.





5 replies on “Surviving the Slashdot effect”
I recently came across your blog and have been reading along. I thought I would leave my first comment. I don’t know what to say except that I have enjoyed reading. Nice blog. I will keep visiting this blog very often.
Joannah
http://linuxmemory.net
This is a cool article and I have posted a link to my twitter account. I will also refer my customers to your AWS experience. You can check out my very own tool CloudBerry Explorer that helps to manage S3 and CloudFront. It is a freeware. http://cloudberrylab.com/
Andy
Hoi Jeroen,
Have you read the article about Hamster power.. for renewable energy yet?
http://deliveriesgalore.com/2009/03/26/hamster-powered-machines/
Joanna
It could be that the keep alive time was set too high in apache and the max number of child processes too high.
If the keep alive is too high, the connection will not be available for any other requests.
http://afewtips.com
another good tool for monitoring your EC2 instances is http://www.monitis.com