Background measurement data lamp measurement articles
Posted by Marcel van der Steen in Explanation No Comments» This article gives the background and explanation of many measurement details and results given in the lamp measurement articles.
From lamp measurement articles links will be used to refer to this explanatory article, and herewith keeping the measurement articles small in length and to-the-point, by preventing the same explanation over and over.
Summary Table
The summary table containing the measurement results of the measured lamp
Column with “m.”: these are the distances from the photometer reference plane to the photometric center of the lamp: 0,25 m up to 5 m.
Columns with ø 50 %: an approximation of the diameters of the light projection onto a flat surface, at mentioned distance from the lamp (see column with “m.” for distances). The beam angle is used to determine the diameter of the light projection; the borders of the light projection are there where the value of the intensity is at 50 % of its value straight underneath the lamp (note that the measurement of the intensity does not change when measured on a flat plane of when measured at a fixed 1 m distance from the lamp, see also here).
In the summary table, the single data “Half-peak diam. C0-C180 gives the equation to compute the diameter. See also the note.
C0-C180 and C90-C270 are planes through the lamp, where C90-C270 is perpendicular to C0-C180. For a tube light the C0-C180 plane is along the length direction of the tube. For a street lamp the C0-C180 plane is along the direction of the street illuminated (often perpendicular to the lamp’s own length direction).
The column with the yellw triangle contains the beam angles ofthe light for the mentioned planes.
E [lux] contains the illuminance values straight underneath the lamp, at mentioned distances. Note that these values are calculated. “Illuminance” gives the equation. See also the note.
Luminaire efficacy is the efficacy of the complete ficture and light bulb. So the lumen per Watt where losses in power supply, optics, reflectors, housing and absorption, efficacy loss due to high tempeatures, are included.
Total output is the total amount of lumen that the lamp emits.
Note: the measurement is done in the far-field (far enough from the lamp that it can be seen as a point source. This means at least 5x the distance of the maximum size of the luminous area of the lamp). This data is then used to calculate the results at 0.25 m – 5 m.
When the distance to the lamp is less than 5x the maximum size of the luminous area of the lamp, then the lamp cannot be seen als a point source of light. The measurement then takes place in the near field of the light and as a result the illuminance values are lower.
With an Eulumdat metric file and a light calculation program the values in the near field can be calculated.
Beam Angle
In all OliNo measurements where the measurement tool BigMama is used, the beam angle is implemented as follows:
– twice the angle where the intensity is dropped to 50 % of its value straight underneath the lamp
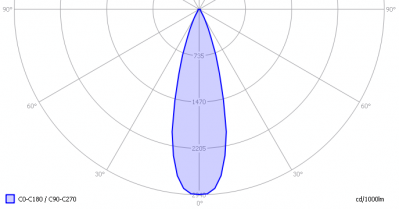
Take as an example the following light diagram.
When using the OliNo implementation, the beam angle for this example would be approximately 30°.
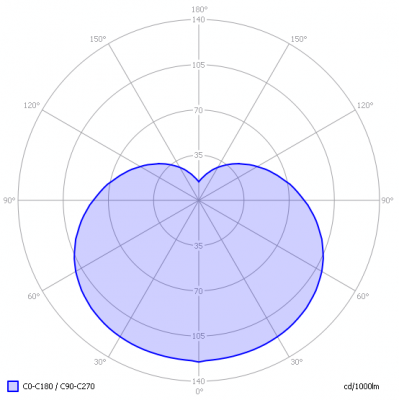
The beam angle is also easily determinable for other light diagrams, see the following for a all-around illuminator.
In this example the beam angle is a bit more than 210°.
The beam angle indicates how focused the lamp’s beam is or how well all-around irradiating.
An apparently different definition which is found on the internet, is the following:
– is the angle between the two directions opposed to each other over the beam axis for which the luminous intensity is half that of the maximum luminous intensity. The luminous intensities are measured in a plane normal to the nominal beam centerline.
An image clarifying further is the following:
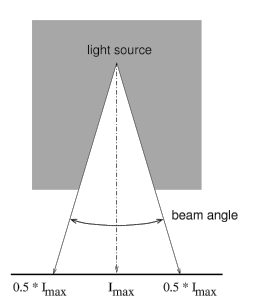
Explicitly mentioned is to measure in a plane normal to the nominal beam centerline, which is also indicated by the image. It shows that at higher beam angles the actual distance from the light source increases as well. But for luminous intensities the distances makes no change on the intensity value (only the illuminance value does)! So this addition suggests that it is important to measure in a flat plane and it suggests that one is getting the light spot diameter on the flat surface (but then the illuminance should have been measured), but in effect one can measure easily the luminous intensity at a fixed distance from the light source and report the beam angle at 50 % values.
As briefly said in the previous paragraph, the image suggests that the diameter of the spot on the flat plane is measured, but for that one shoudl measure the illuminance values that are measured on the flat plane. Indeed these values do depend on distance to the light source as well. But then the determination of light spot diameters would work for light spots with relatively small diameters; it would not work for light bulbs with higher beam angles as the distance to the light source will result in dropping the illuminance value quickly to 50 % and hence there is then a maximum beam angle anyway, that does not say anything about the light pattern around the lamp.
Light Diagram
Eulumdat file ius a photometric file that contains a lot of information about the amp (light bulb including luminaire), for instance for Eulumdat:
1) total light flux in lumen
2) distribution of light around the lamp (light diagram)
3) CRI value
4) color temperature
5) consumed power
6) dimensions of luminous area of the lamp
7) at what inclination and turn angles is measured etc.
With the program Qlumedit the Eulumdat formatted text files can be opened and analyzed. Also some parameters can be changed, such as company name and lamp name. A light diagram is given with the C0-C180 and C90-C270 planes. The norm EN 13032-1:2004 reports the following.
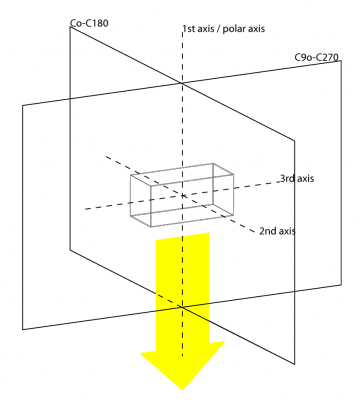
The planes C0-C180 and C90-C270 with respect to the measured lamp
The lamp is the rectangular shap in the center.
The first axis (also called polar-axis) travels trough the photometric center of the lamp and is perpendicular to the plane through which the lamp emits the most light (the yellow arrow in the drawing).
The third axis is, for linear lamps (the ones having a length direction such as tube lights), in the length direction of the lamp. This corresponds to the C90-C270 plane. These lamps normally give the most light in the plane perpendicular to the C90-C270 plane. The C0 plane must normally be the plane that contains the most light, and in case of symmetry, the C0-C180 plane is the plane with the most light.
For (A) light bulbs + luminaires with their axis the same as the first axis, and (B) for luminaires with multiple light bulbs, and (C) for light bulbs without lamp-axes, the following holds:
1) C0 is the plane whit the most light of the lamp.
2) C0-C180 plane is the plane with the most symmetry.
Note that this is a guide line. In any case the manufacturer of measurement insitute indicates the positioning of the planes. This leaves room for own positioning.
Note for street lights. The C0-C180 plane is chosen alongside the street.
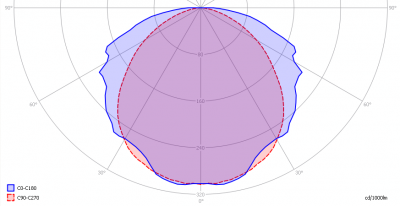
Here an example of a light diagram that Qlumedit shows when it has read a correct Eulumdat file.
The light diagram for the C0-C180 and C90-C270 planes
The unit is Cd/klm (klm = kilo lumen). This enables comparisons; say a 120 cm long tube light has a value of 100 Cd/klm in the 0° direction. This means that when a number of these tubes, physically close to an other, would give in total 1000 lm, than then the intensity right underneath them would be 100 Cd.
When taking the 150 cm variant of the same tube, it will most likley have 1.5/1.2 x more intensity (Cd) in the same direction, and will give 1.5/1.2 x more luminous flux in total. Result is that the parameter expressed in Cd/klm remains the same; less tubes are needed to get to 1000 lm and hence the intensity will remain the same.
A different type tube light ca have 200 Cd/klm in the same 0º direction. Placing that many tubes such that their sum equals 1000 lm, then the intensity will be 200 Cd.
This way the lamps can be compared.
Also it is possible to get luminous intensity values in Cd from this graph. To obtain these, multiply the found values by the total lumen output of this light bulb and divide by 1000. So if the lamp emits 200 lm in total, then the multiplication factor is 200/1000 = 0.2 to get the Cd values.
Photometric Center
The determination of the positions of the photometric center follows certain rules. Herewith some rules of thumb.
1) when a luminaire has a reflector, the photometric center is aligned with the output of this reflector, and situated in the center
Lamp with reflector its photometric center (red dot)
2) when the luminaire has matte or prismatic sides, with the light bulb simewhere inside these sides, then the photometric center is situated in the center of the volume made by the sides
Luminaire with matte sides
3) when the luminaire and light bulb are clear, and the luminous surface is visible (the filament for instance, or the tube of a compact saving lamp) then the photometric center is the meometric center of the luminous volume
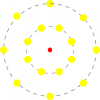
Left an energy saving lamp, and right a lamp with many light sources
PAR
To make a statement how well the light of this light bulb is for growing plants, the PAR-area needs to be determined. PAR stands for Photosynthetic Active Radiation which is that radiation that participates actively to photosynthesis and is expressed in μMol/s/m2.
Photosynthesis is the essence for growth and flowering of plants, where the blue part of the light spectrum is responsible for growth and the red part is responsible for flowering and budding (for gemmation). For photosynthesis it is more important to count the number of photons rather than the power in the light.
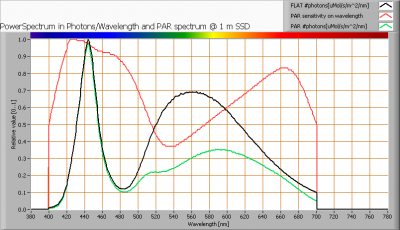
The power spectrum (power per wave length) of the light of the light bulb is converted into the number of photons (number of photons per wave length) and then these number of photons is weighted against the relative sensitivity of an average plant (which varies in value dependent on the wave length). The relative sensitivity curve in DIN-norm 5031-10:2000 is used for this. The next image shows an example of a result.
The photon spectrum, then the sensitivity curve and as result the final PAR spectrum of the light of this light bulb
The black curve gives the power spectrum of the light of this light bulb, in number of photons per wave length.
In red the relative sensitivity curve of an average plant (according to DIN norm 5031-10:2000).
Obtaining the PAR value: Multiplying these two results in a curve showing the number of photos per wave length of the light of this light bulb, the PAR spectrum. Summing these results over the interesting wave lengths, gives the PAR number for the light of this lamp. In this example 2.4 μMol/s/m2. This value is valid at 1 m distance from the light bulb and for the area within the beam angle.
It is not said that all photons are absorbed; this depends a.o. the ambient temperature, the availability of nutrition (water, salts) for the plant etc.
Obtaining the (PAR-)photon efficiency: this value is expressed in [μMol/s/We] and indicates the total photon current per second [μMol/s], divided by the consumed power [W]. To get the total photon current it is computed as follows:
– Computed already is the PAR-value in [μMol/s/m²],
– Available is the relation between Ev [lx] at 1 m distance (being Iv [Cd] if we are in the far field and can consider the size of the illumination area small compared to the measurement distance) and the total photon current Φv [lm], being Φv/Ev@1m,
– Known is the total consumed power.
As a result the total photon current is [μMol/s]:
and the PAR-photon efficiency in [μMol/s/We]:
PAR efficacy: Dividing the PAR number by the total number of photons of the light of this light bulb gives a sort of PAR efficiency, which is 66 % (valid for the PAR wave length range of 400 – 700 nm). So maximally 66 % of the total of photons in the light is effectively used by the average plant (since the plant might not take 100 % of the photons at the frequency where its relative sensitivity is 100 %).
Note: when mentioning this percentage of efficiency, it is important to verify if all wavelengths are present in a sufficient manner. Not that only blue light is available, when the plant is going to be used for flowering where specifically red light is needed.
S/P-ratio
The human eye uses rods and cones. The rods work at scotopic light levels (twilight, night) and the rods at high(er) light levels (daytime, but also close to twilight). Each type of receptor has its own sensitivity for light. The rods are 2.7 times more sensitive than cones, and most for light at a blueish-greenish color whereas compared to the cones’ sensitivity for green light (555 nm).
The S/P ratio gives the maximum difference in sensitivity of the rods at their most sensitive wavelength compared to the cones at their’s. The more blueish (cold white) the light, the more the S/P ratio can be.
The light of this light bulb has a certain spectrum leading to an S/P ratio of 1.9. The light of this lightbulb at scotopic light levels is perceived this factor higher than it would be a photopic light levels.
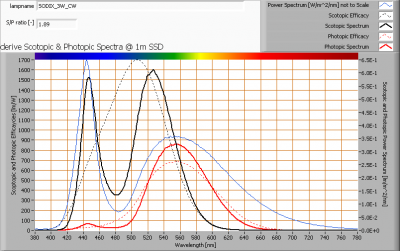
The power spectrum, sensitivity curves and resulting scotopic and photopic spectra (spectra energy content defined at 1 m distance).
There’s a lot of blue with respect to green/yellow (see the blue line), resulting in an S/P ratio which is high being 1.9.
Dim-ability
When the lamp can be dimmed, then that will be measured as well. There are some dimmer types mentioned here. After that the obtained results with measurements done while dimming are explained.
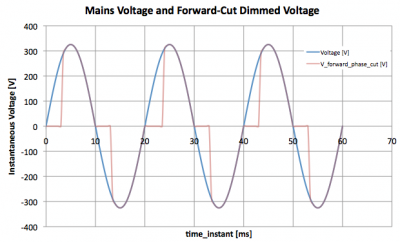
Dimmers with forward phase cut principle, also the L, and R type dimmers. These dimming devices will cut the start of the phase of the voltage. When the voltage first crosses the 0-value and then wants to go upwards in value, then the dimmer holds its value to 0 until a certain moment in time where it instantaneously switches the voltage accross the load (in this case the lamp). At this moment the lamp can burn. As soon as the voltage crosses again the 0-value then it will be blocked again.
Forward phase cut dim principle on the grid voltage
More dimming action means the cut-off will last longer so the time-delay before the voltage is put across is longer. Less dimming action means the cut-off lasts shorter in time. Even when the dim-unit is put a 0 % dimming, there will most likley be some forward-cutting of voltage hence there is some loss in voltage, reduced power consumption and hence light output; a lamp will normally be brighter when used without a dim-unit compared to when it is used with a dim-unit set at 0 % dimming.
Dim-units working on the forward phase cut principle work fine with loads that can deal well with a sudden voltage put across them. All resistive loads (lamps with filaments) as well as inductive loads (with coils in series for instance) can deal with this. When a sudden voltage is put across a coil then this coil will ensure a smooth ramp-up of the current.
Loads that are capacitive will not like a sudden voltage across them; a peak current is what results that can lead to burn down of board tracks, fuses, spikes on the grid, noise pick-up on FM receivers positioned near, malfunctioning sensitove electronic devices positioned near enough etc.
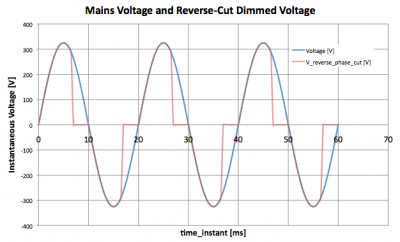
Dimmers with reverse phase-cut principle, also tghe C and R type dimmers. These dimming devices will leave the voltage untouched as soon as it crosses from 0 and goes up in value. Then after a while after its 0-crossing, the voltage will be blocked suddenly, this until the next 0-crossing takes place. Then the cycle will start over again.
Reverse phase cut dim principle on the grid voltage
More dimming action means the cut-off will start earlier after the o-crossing resulting in a longer time period where the voltage is blocked. Less dimming action means the cut-off will take place later after the 0-crossing of the voltage. Even when the dim-unit is put a 0 % dimming, there will most likley be some reverse-cutting of voltage hence there is some loss in voltage, reduced power consumption and hence light output; a lamp will normally be brighter when used without a dim-unit compared to when it is used with a dim-unit set at 0 % dimming.
Dim-units working on the reverse phase cut principle work fine with loads that can deal well with a sudden removal of voltage across them. All resistive loads (lamps with filaments) as well as capacitive loads (with capacitors or switching mode power supplies) can deal with this. When suddenly the voltage is blocked, then a resistive load will just have its current through it stopped immediately and a capacitive load will for a short while keep the voltage across it as it was at the end before switch off and then the stored charge will leak away and the voltage will drop in value in a smooth way.
Loads that are inductive will not like a sudden voltage blocked; as they established a current through them, they tend to keep that current flowing even when the voltage is blocked, leading to peak voltages (voltage spikes). These voltage spikes might lead to breakdown of components, emissions of electromagnetic fields resulting in noise pickup of FM receivers, or malfunctioning of sensitive electronic devices etc.
The dimmer used in the OliNo lamp measurement tool is a dimmer that can cut phase in forward as well as reverse way. It determines the correct way automatically (the Elimpo DIM M1X10). This dimmer is driven with an analog voltage between 0-10 V and in 50 small steps the dimming action is varied from minimal dimming to maximal dimming. While dimming the load, a set of interesting lamp parameters are measured.
The interpretation of the resulting dimming graph
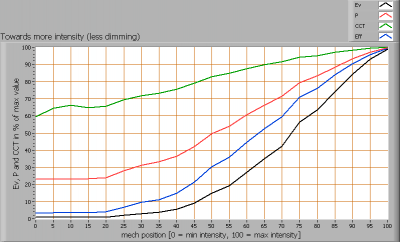
Dim measurement result when a dim-able lamp is dimmed and measured
The x-axis gives the amount of dimming applied; from 0 % (dimmen maximally) to 100 % (no dimming). The knob of a wall-dimmer helps interpreting it; turning CCW means lamp more and more off, and means towards 0 % in this graph, and turning CW means lamp more and more on, and means towards 100 % in this graph.
The y-axis shows relative results of four interesting lamp parameters. They all start with 100 % at no diming (so 100 % on the x-axis). When dimming action is increased (going to the left on the x-axis) the illuminance value (Ev) will decrease; this shows a black line that decreases in value when going from right to left.
The red line: the consumed power. At more dimming this should also decrease, since less light is being generated. For filament type lamps the power will decrease less quickly as the illuminance value does, resulting in a decrease of the efficacy. For led lamps the decrease of both illuminance and consumed power is more on par.
The luminous efficacy is the blue line. In this example, this value decreases. The efficacy is computed by dividing the Ev value by the P-value.
Last the correlated color temperature CCT in green. In this example this value decreases with more dimming, which is a normal result when dimming filament lamps; the power decreases with more dimming and so does the heat generated in the filament, and this decreases the temperature, giving more yellowish/reddish light.
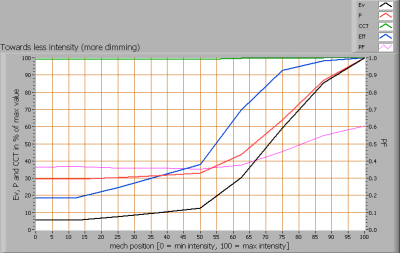
Extension per Jan 2010: the power factor will be given for the measured dimming positions. An example is the following graph:
Lamp parameters dependent on the dimming position.
The power factor’s value is given on the right y-axis. In this example the power factor reduces when dimming is increased. The voltage waveform and current waveform change due to the phase cutting effect of the dimmer.
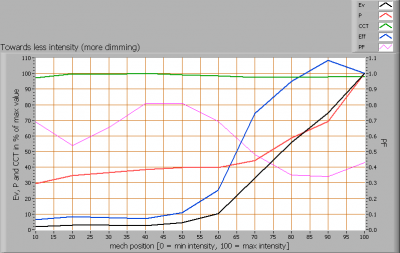
An additional worked out example of dimming an a dimmable lamp, in this case with an L,R type dimmer.
Lamp parameter values dependent on the dim position.
The power factor decreases and then increases (with more dimming applied). It is not possible to forecast what the power factor will do with more dimming.
In this example the currents are measured (as well as the voltage) when dimming was applied. 70 % position means 30 % dimming and 70 % no dimming (so relatively close to not using a dimmer).
Sequence is: no dimmer, dimmer 100% (meaning no dimming), dimmer 90%, dimmer 80%
Sequence is: dimmer 70%, dimmer 60%, dimmer 50%, dimmer 40 %
Sequence is: dimmer 30%, dimmer 20%, dimmer 10%, dimmer back to 100 %
Introducing the dimmer into the circuit, and then by putting it not to dim, has its effect resulting in peak currents. The power factor drops. Increasing dimming levels makes the power factor come back to its normal value.
Putting the dimmer back to its 100 % position after it has been set to 10 % results in a different (better in this case) power factor than with its first setting to 100 %.
No general statement can be given on what the current and power factor will do when a dimmer is introduced.
Power Factor
The power factor as determined by OliNo, is computed with help of a lot of samples on the voltage across and current through the lamp (light bulb + power supply or current driver). 10 kS/s are taken, both for the voltage as well as for the current. Sampling is done for two seconds, so in total 20.000 samples are available. The consumed power is then computed as follows:
The apparent power is computed as follows:
Finally the power factor:
The computations use the 20000 samples. The validation of this is done while measuring on a lamp with a current through it that had a lot of peaks in it. The PF was computed and then slowly a resample was done with lower sample speed. The PF result remained constant/stable with 2 digits, for sample speeds down to 3 kS/s. This way, when using 10 kS/s this speed is enough to accurately determine the power factor, even for current forms that have a lot of glitches or peaks.
As samples are taken, also the power factor for different voltages, such as 12 V AC can easily be determined.
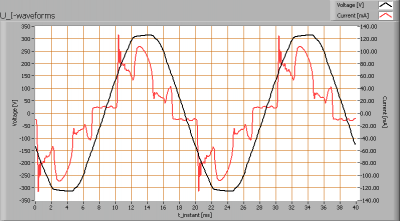
The voltage – and current form are represented in a graph, as the following example shows.
The voltage- and current shape of the voltage across and the current through the lamp
Sampling during two seconds on AC of 50 Hz gives 100 periods that are sampled. The graph shows two periods and these are the average of 50 sets of two periods.
The current in this sample shows a lot of peaks. When sampling at 10kS/s, there are 200 samples in one period (period of 20 ms) and this is enough to accurately determine the shape of the current. Small peaks and steep edges are well visible in the signal, meaning that the current is well represented and as a result the power factor calculation is accurate.

